Blog
Life Cycle Assessment (LCA) and Carbon Footprint (CFP)
– Part 1: Features, Implementation Methods, and Considerations
2024/04/12
In recent years, there has been a global movement towards achieving a sustainable society by focusing on reducing CO₂ emissions and promoting resource circulation through methods such as recycling. You may have noticed an increase in products labeled with statements like “X% reduction in CO₂ emissions compared to conventional products” on store shelves.
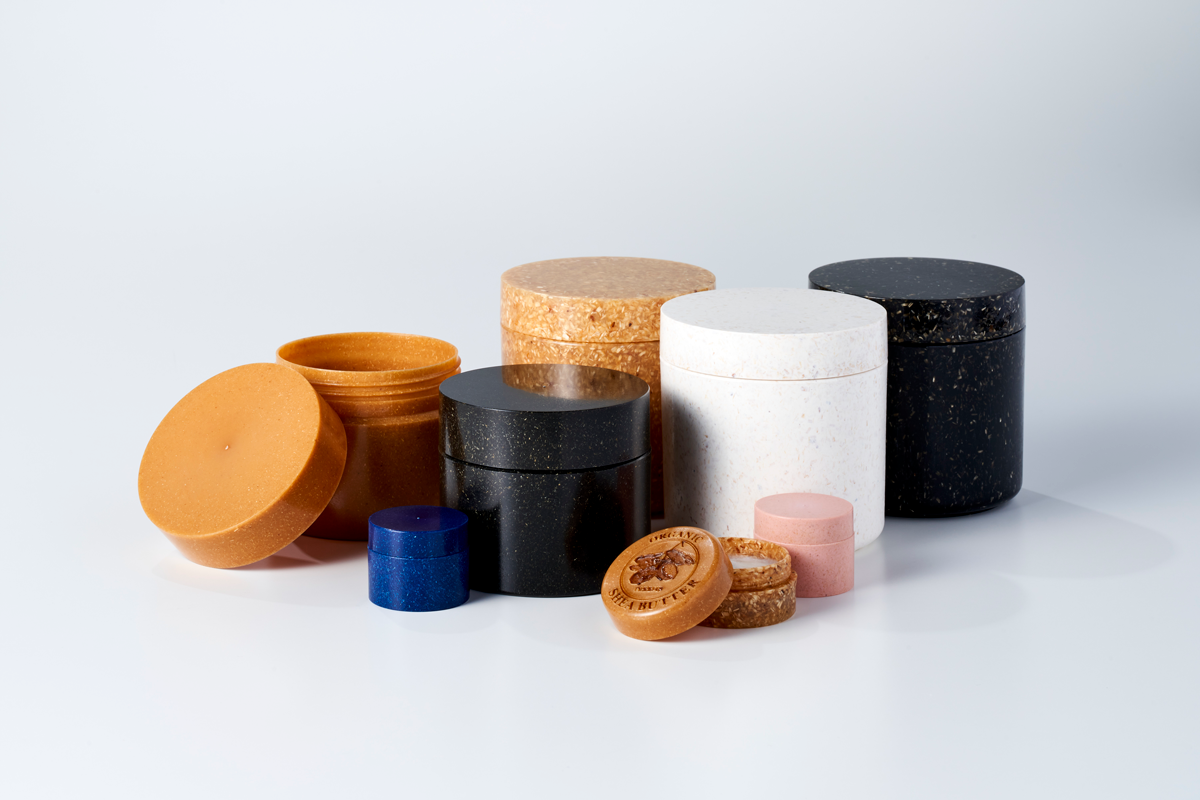
At NISSHA, we handle molded products (packaging, containers, etc.) using plant-derived materials. As we introduce these products, we have increasingly encountered terms such as “CO₂ emission reduction” and “decarbonization” from our customers. Therefore, in this article, we explored “Life Cycle Assessment (LCA)” and “Carbon Footprint (CFP)”.
This blog is divided into two parts.
In Part 1, we will explain what LCA and CFP are, their features, differences, implementation procedures, and considerations.
In Part 2, we will showcase the Carbon Footprint (CFP) of Sulapac® , a bio-composite material handled by NISSHA.
What is Life Cycle Assessment (LCA)?
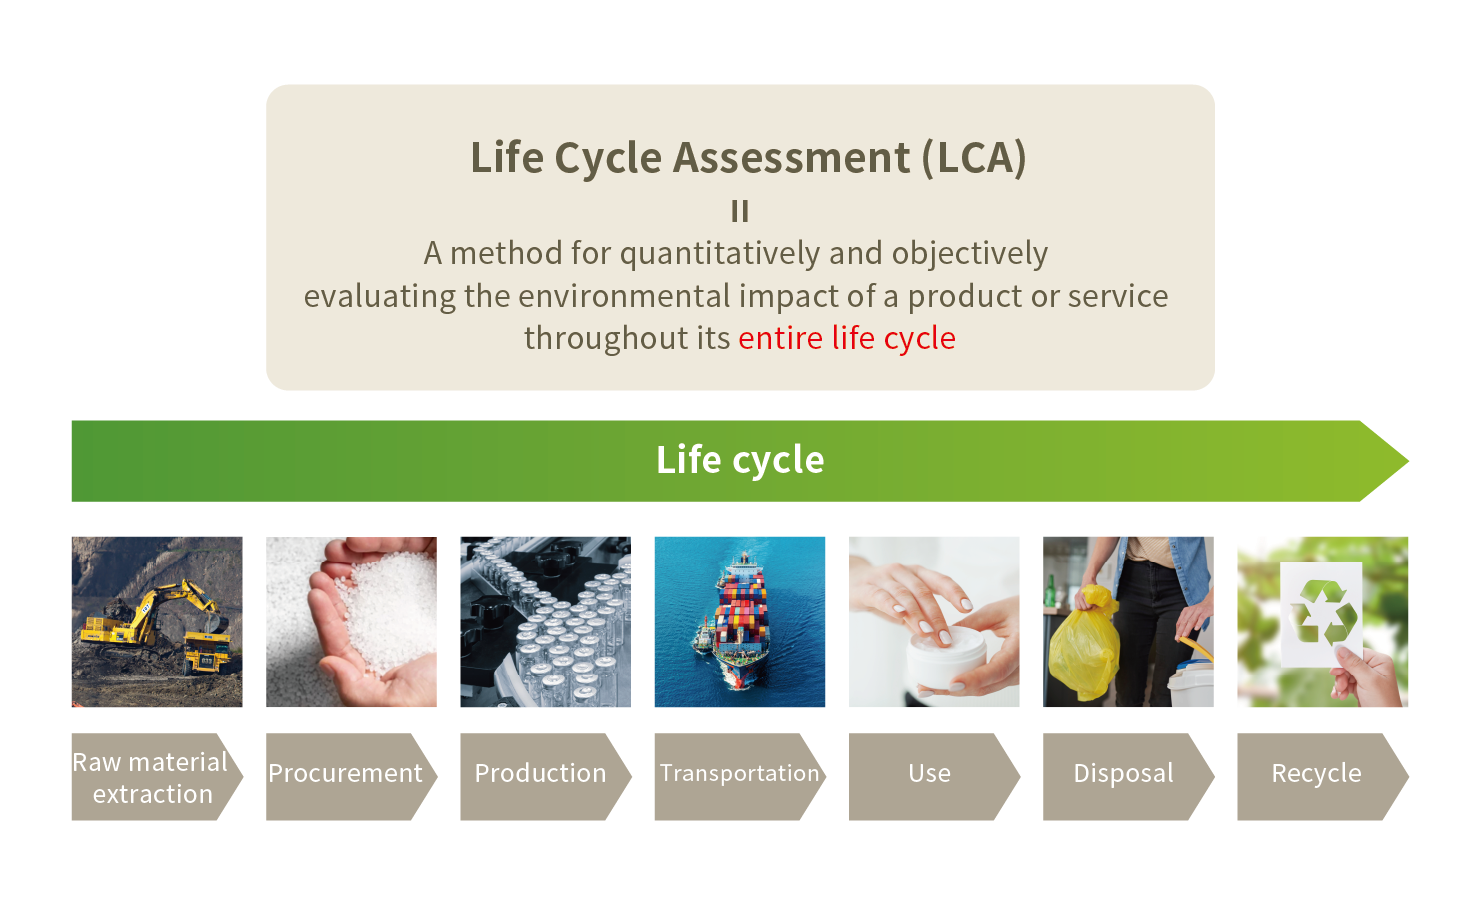
Life Cycle Assessment (LCA) is a method for quantitatively and objectively evaluating the environmental impact of a product or service throughout its entire life cycle.
The entire life cycle encompasses all processes from raw material extraction, procurement, production, transportation, use, disposal, to recycling, as illustrated in the diagram below.
Implementation Methods of LCA
The general overview of LCA implementation methods is defined by the international standard ISO14040(2006), with detailed procedures specified in ISO14044(2006). Adhering to these standards ensures international recognition of LCA results.
Features of LCA – Part 1
There are two main features of a Life Cycle Assessment (LCA).
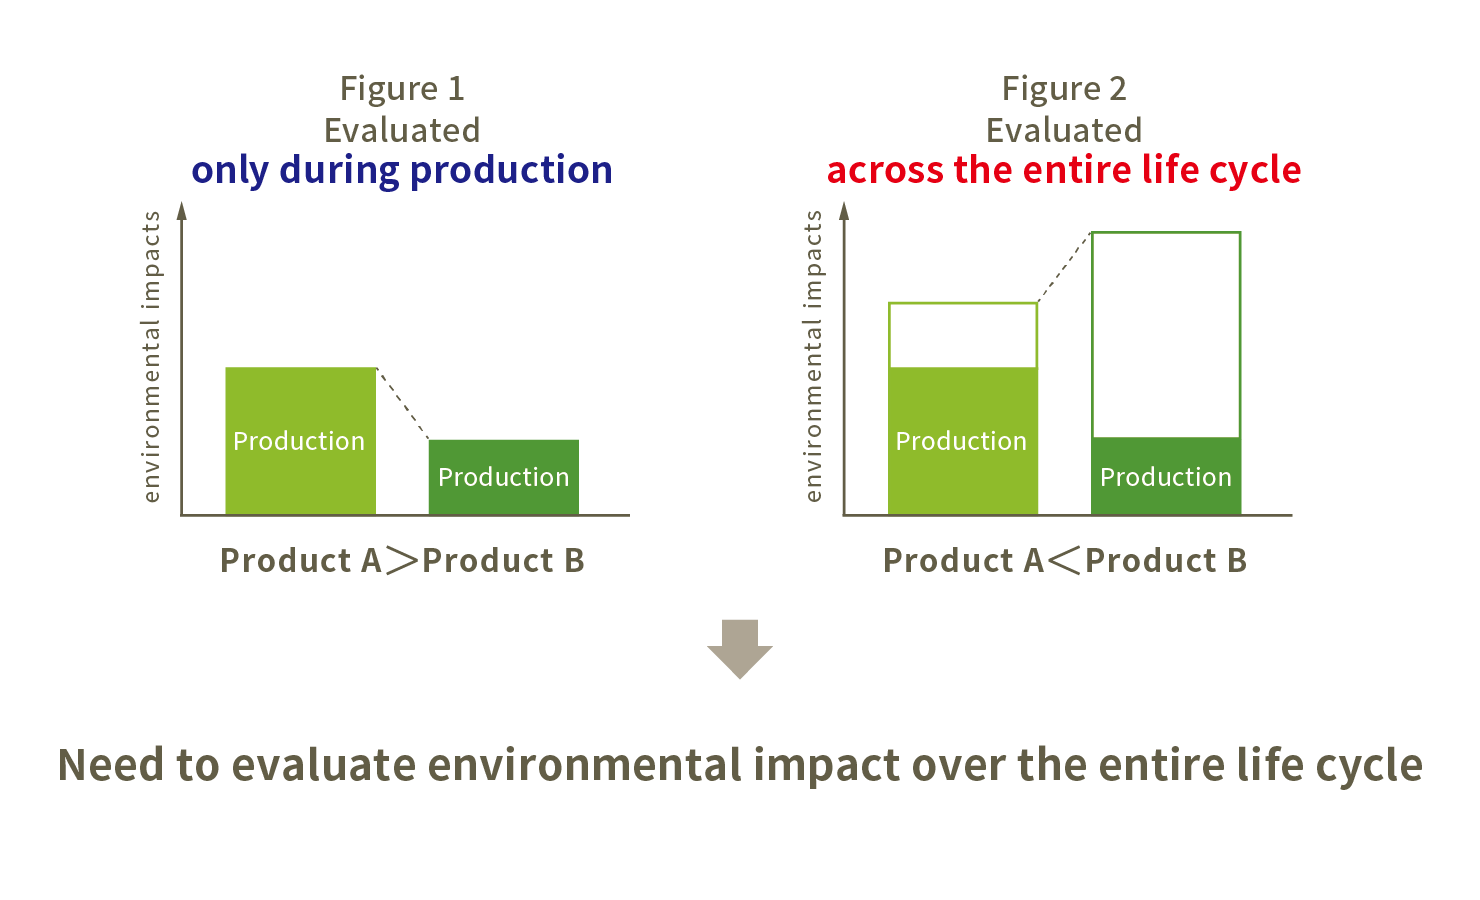
The first is the requirement for a comprehensive evaluation of environmental impacts throughout the entire life cycle.
For example, consider a situation where product B has a lower environmental impact during production than product A, as shown in Figure 1. However, when evaluating environmental impacts across the entire life cycle, as shown in Figure 2, a reversal phenomenon may occur where product B has a higher environmental impact than product A.
Therefore, to quantitatively evaluate the environmental impact of a product or service, it is necessary not to evaluate just a part of the life cycle, but to evaluate the entire life cycle.
Features of LCA – Part 2
Another feature of a Life Cycle Assessment (LCA) is that it covers a wide range of items for evaluating environmental impacts.
In addition to the commonly heard “CO₂ emissions,”greenhouse gases, ozone layer depletion, acidification, ecosystem destruction, air pollution, water pollution, etc., can also be evaluated in an LCA, and the evaluation items can be selected at will. These evaluation targets cannot be measured by the unit of CO₂ emissions alone, so they need to be calculated in the most suitable unit for each item.
When implementing an LCA, it is important to determine which items are the priority issues. Even if a product is broadly categorized as having a “low environmental impact,” it does not necessarily have a positive effect on all items. Compared to other products, a product may have a smaller environmental impact on certain items, but it may have a larger impact on other items. Therefore, those implementing the LCA also need to consider what items they prioritize.
Summary
In conclusion, the Life Cycle Assessment (LCA) has been gaining attention in recent years as an effective method for determining whether a product or service is “comprehensive,” “quantitative,” and “objective” in its environmental friendliness.
What is Carbon Footprint (CFP)?
“Carbon Footprint (CFP)” is a measure of the impact on climate change.Therefore, it only evaluates greenhouse gases that have a high impact on climate change.
Greenhouse gases (GHG) refer to components in the atmosphere that cause a greenhouse effect, including not only CO₂ but also methane, nitrous oxide, and fluorocarbons. The magnitude of the greenhouse effect varies depending on the gas. For example, methane has 25 times the greenhouse effect of carbon dioxide, and nitrous oxide has 298 times the effect.
Procedure for Implementing CFP
The “GHG emissions” emitted at each stage of a product’s lifecycle are converted to “CO₂ emissions” to quantitatively calculate the environmental impact. *It is preferable to refer to the latest IPCC assessment report for the target substances and conversion factors to CO₂.
The procedure for implementing CFP is as follows:
1.Define the calculation range of the lifecycle
2.Calculate by summing the GHG emissions at each process
The calculation range of CFP is typically said to be one of the following two:
“Cradle to Grave”…From the beginning to the end of the lifecycle, that is, from raw material procurement to disposal/recycling.
“Cradle to Gate”…The range from raw material procurement to production in the life cycle.
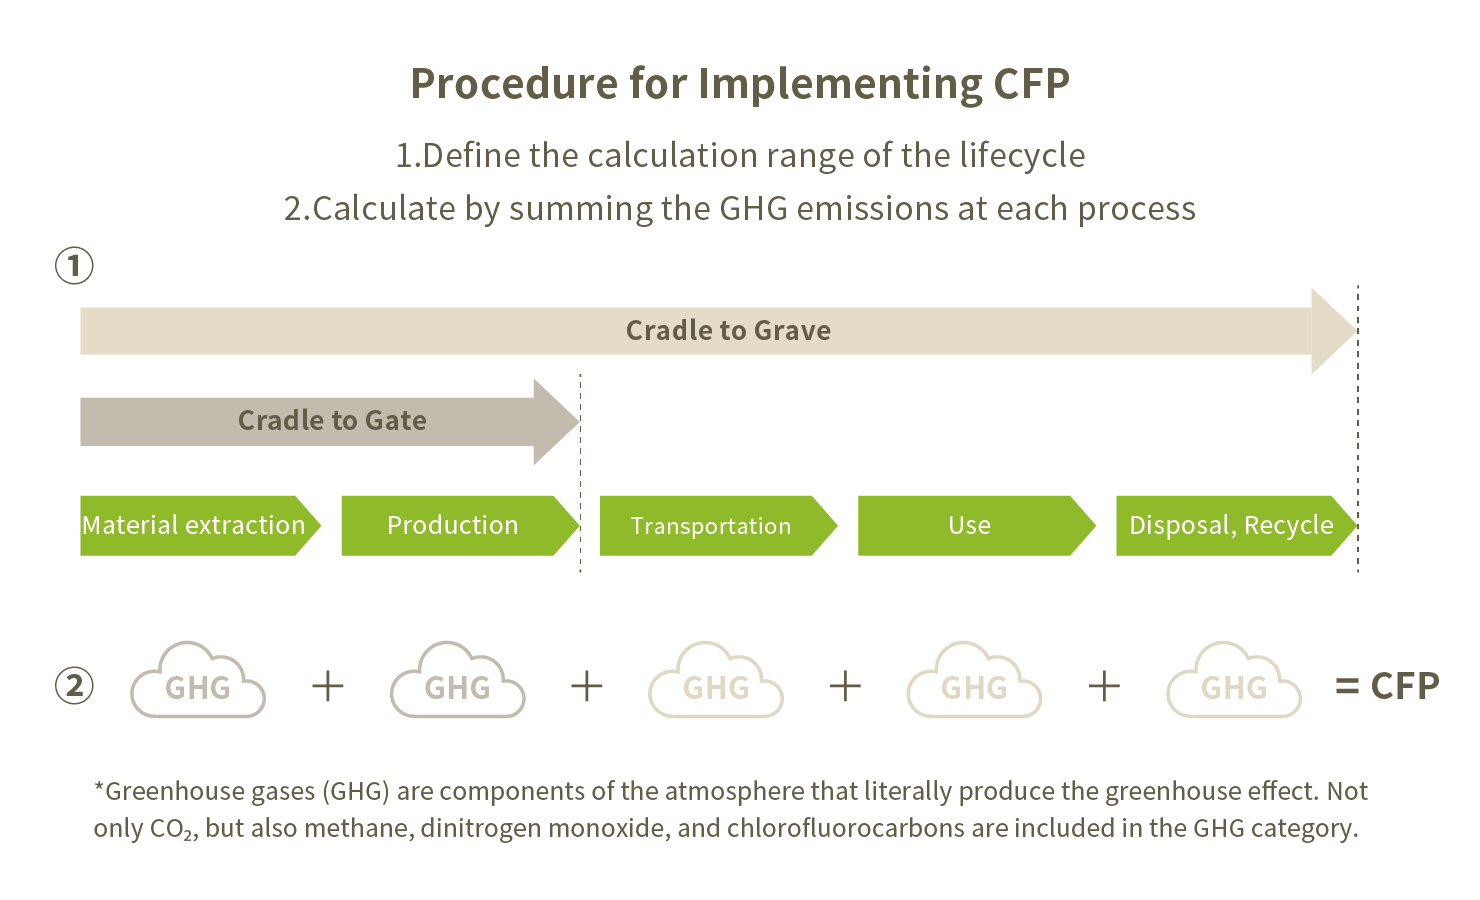
The calculation range is often determined by whether the product is a final product or an intermediate good. For final products, the “Cradle to Grave” calculation is basic, while for intermediate goods, the “”Cradle to Gate” calculation is often used.
The reason for this is that it is difficult to accurately calculate the distribution, use, and disposal/recycling methods of intermediate goods such as raw materials, materials, and parts, as they vary widely.
Summary
The Carbon Footprint (CFP) is a system that visualizes the GHG emissions at each stage of a product’s lifecycle, enabling us to understand which processes should be prioritized for emission reduction.
Difference between LCA and CFP
The major difference between LCA (Life Cycle Assessment) and CFP (Carbon Footprint) is the target of environmental impact assessment.
In LCA, there are multiple items that can be evaluated for environmental impact, such as “ozone layer destruction, acidification, ecosystem destruction…” etc., while CFP targets only “GHG emissions”.
Points to note in the calculation of LCA and CFP
Finally, let’s introduce some points that need to be noted when calculating LCA and CFP.
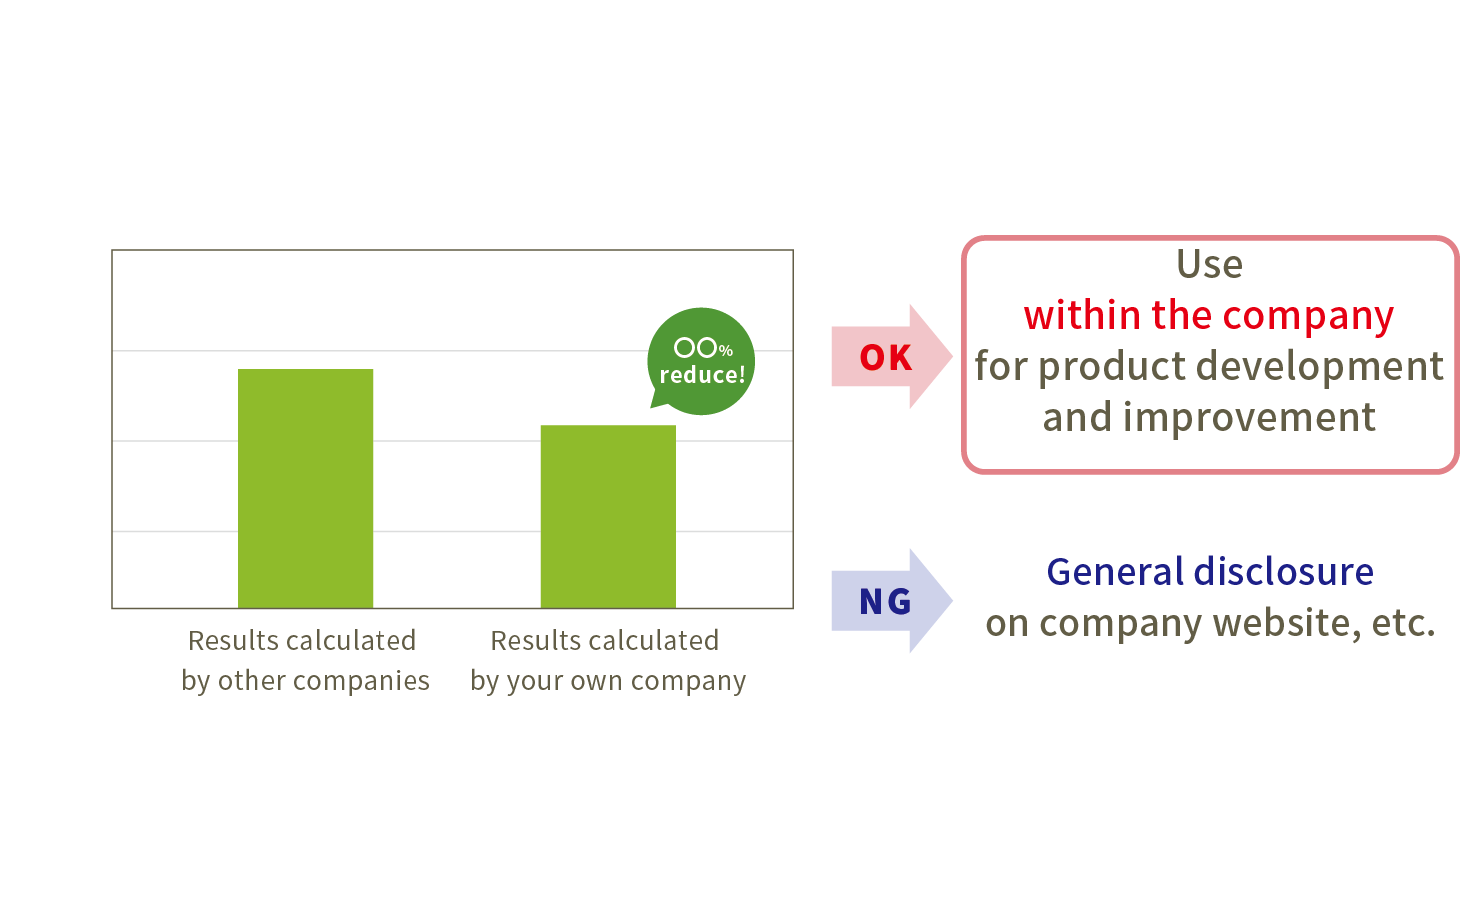
In both LCA and CFP, it is prohibited to compare the results calculated by your own company (your own products) with the results calculated by other companies (other companies’ products). This is because even if the products are the same, the results can vary greatly if the conditions for calculation are different. Therefore, simply comparing the results calculated by your own company with those calculated by other companies can lead to greenwashing (making it appear as though there is an effect even though there is actually no improvement in the environment), which is why it is prohibited. However, it is possible to use the calculation results within the company for product development and improvement.
CFP of Cradle-to-Gate Plastic
For reference, I will list the data of the CFP of petroleum-derived plastic announced in the public database. *You can see that the results vary greatly depending on the source of information, even for the same type of plastic.
- Data published by Plastics Europe
- CFP of HDPE (High-Density Polyethylene) is 1.80kgCO₂eq./kg*
- CFP of PP (Polypropylene) is 1.63kgCO₂eq./kg
- Data published by GPCA (Gulf Petrochemicals and Chemicals Association)
- CFP of HDPE is 1.70kgCO₂eq./kg
- CFP of PP is 1.95 kgCO₂eq./kg
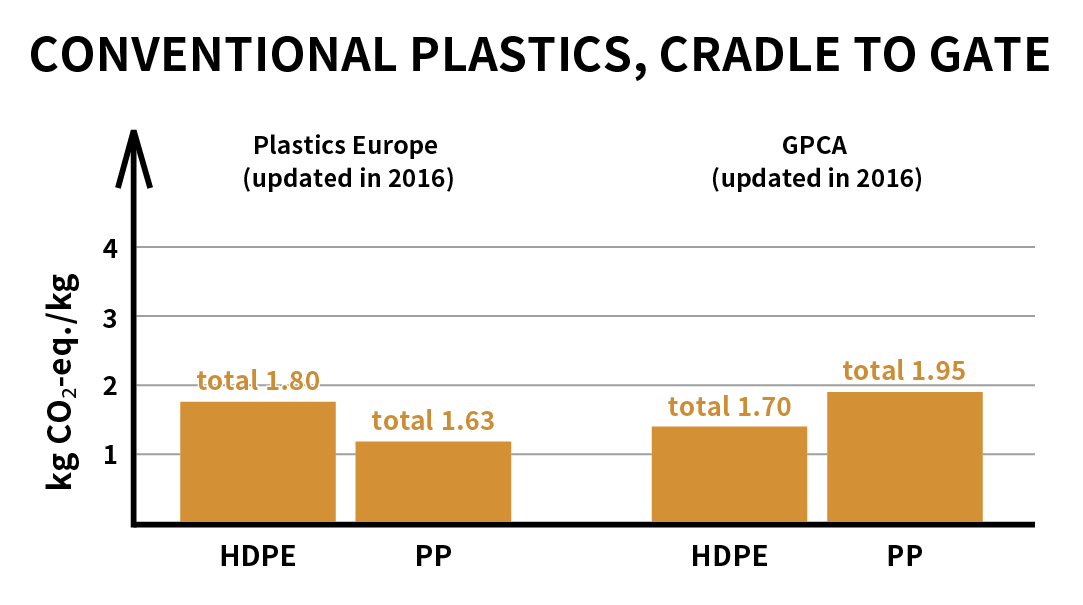
*Quoted from: Reduce your carbon footprint with Sulapac
*CO₂eq stands for “CO₂ equivalent”, which is a value converted to CO₂ equivalent using the global warming potential (GWP). Million t-CO₂eq means million tons of carbon dioxide equivalent.
Summary
LCA (Life Cycle Assessment) and CFP (Carbon Footprint) are evaluation methods that can visualize the overall, quantitative, and objective environmental impact of a company’s entire supply chain. However, if used incorrectly, they can lead to greenwashing, so care must be taken in their use.
Moreover, since LCA and CFP are evaluation methods under development, there are challenges. For example, the results will differ depending on the method of power generation used when procuring raw materials, but it is easy to imagine that it is difficult to pinpoint this accurately. Ideally, individual suppliers should share numbers calculated using a consistent calculation method (primary data) across the supply chain and use them to calculate LCA and CFP. However, currently, it is common to use databases such as IDEA, which lists industry-average emission coefficients (secondary data), for calculations. To perform more accurate LCA and CFP calculations, it is necessary to increase the usage ratio of primary data, which is a challenge for the future.
In Part 2, we will introduce the CFP of NISSHA’s biocomposite material Sulapac®.